Plate Boundary Features Exploration
Your Objective
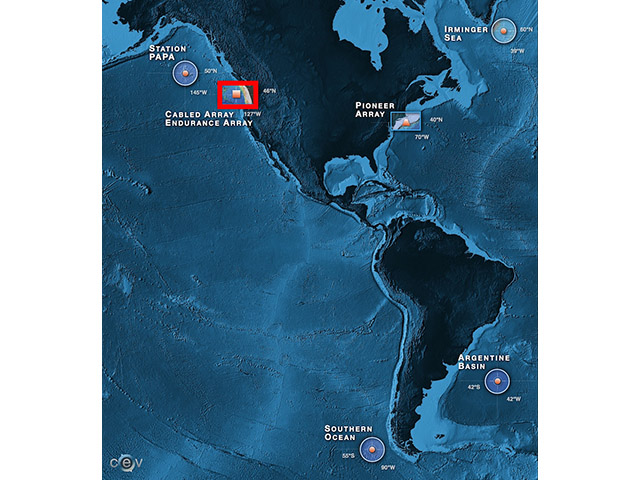
Use earthquake data from plate boundaries in ocean regions off of the Pacific Northwest to look if there are patterns between 2010-17.
- Make a prediction about what kind of patterns in earthquake magnitude and location you may observe over time.
- Explore the data below to see what you can observe.
Automatically select:
Data Tips
When the site loads, you are able to see all of the earthquake data from 2010 throughout the Coastal Endurance Array. You can interact with the data by:
- Selecting a different part of the time series to explore the data in ways that interest you by moving the highlighted section of the bottom graph to the right or left.
- Zooming in and out of the data to look at different time scales that interest you by changing the width of the highlighted section of the bottom graph (it loads with all of the data highlighted).
- Zooming in and out of the map to see more or less of the area of the ocean the earthquakes occurred.
Note, the color denotes earthquake depth, with darker blues representing deeper depths (up to 50km) and dark red representing shallower depths (0km). The yellows are in-between. The circles on the map are sized by the earthquake magnitude.
Questions for Thought
Orientation Questions
- Across what geographic area are you able to observe earthquake data in this map?
- What is the range of earthquake size (magnitude) in these data?
Interpretation Questions
- What changes or patterns did you observe in earthquake location over this time period in the Northern Pacific Ocean?
- Where did you see these changes or patterns?
- What changes or patterns did you observe in earthquake magnitude over this time period in the Northern Pacific Ocean?
- What questions do you still have about what we can learn about plate boundaries from earthquake data over time?
Background Information
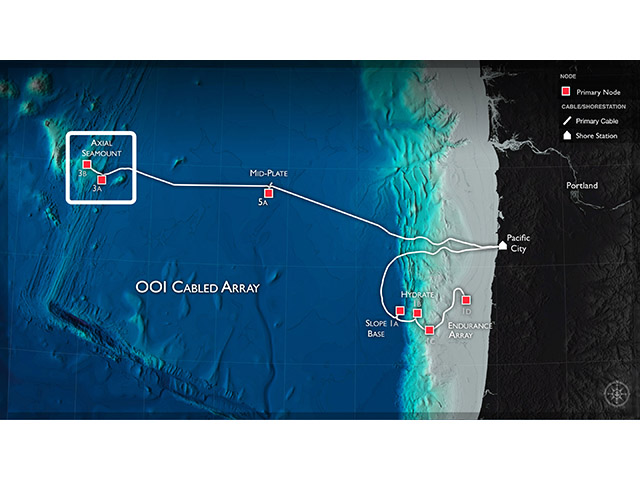
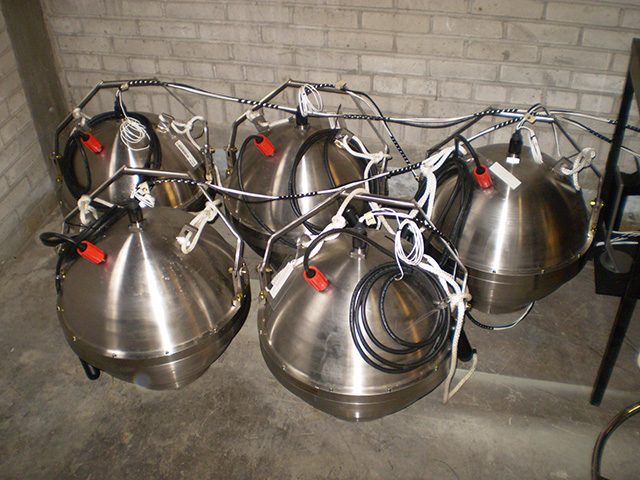
Click on the images below to learn more about where and how the dataset above was collected.

Dataset Information
Data for this activity were retrieved from the USGS Earthquake Catalog.