Data Explorations Instructor's Guide
How Are the Data Explorations Set-up?
Data Explorations combine current learning science theory, data visualization user design, and effective teaching with data practices to provide easy-to-use interactive experiences with authentic data.
For each data set there are multiple ways that a student can interact with the data, depending on the desired learning outcome. This provides you as the professors to choose which data set and approach best fits your desired intention of using it in your classroom.
Another way the Data Explorations are built with flexibility in mind is that they are each designed to take 15-20 minutes. They are intended to augment your current teaching on a topic, not fully teach the topic. Therefore, you can add them into your teaching whenever and wherever you think it would be best as data can be used at many different phases of The Learning Cycle.
What is The Learning Cycle?
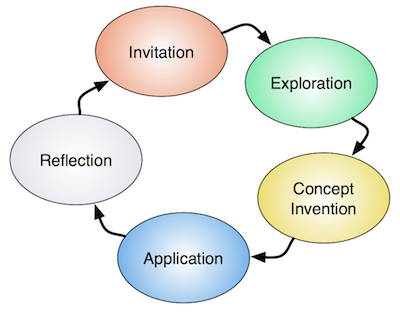
The Learning Cycle is an approach to designing learning experiences that capture best the knowledge and theory of how people learn, which was developed by the University of California, Lawrence Hall of Science. There are five phase of The Learning Cycle:
- Invitation
- Exploration
- Concept Invention
- Application
- Reflection
Each phase offers an important step in assisting students in their learning and understanding of the concepts being covered. To facilitate students learning in at each phase we use different approaches, experiences, and prompting questions for the students. Therefore, the Challenge Question, Your Objective, and Interpretation & Analysis Questions among the different Data Explorations for the same data set vary.
The Learning Cycle can be replicated at different scales from as small as within an activity to as large as across a whole unit/semester. The key is providing your students opportunities to engage in each phase of The Learning Cycle. Each Data Exploration has been designed to be utilized for a specific phase, however multiple Data Explorations per data set have been developed so that you can best choose which way you want to use those data in your teaching.
How Are the Data Chosen?
We begin with a freely available online data portal, for example the Ocean Observatories Initiative Data Portal, and determine what kinds of data are available across what spatial and temporal scales.
Then we consult with commonly used textbooks for introductory courses, for example The Essentials of Oceanography, to highlight which concepts covered in the textbook could be augmented with the available data.
After drafting learning objectives based off of the textbook concepts and The Learning Cycle, we dive into the data portals to extract and process the most relevant data to utilize in the Data Exploration interactives.
How Are the Interactives of the Data Explorations Developed?
Using the learning objectives as our guide as well as the quantity and quality of the available data, we design the interactive component of the data exploration to maximize learning and minimize user frustration.
The interactives are prototyped and revised for usability, ability to accomplishing the desired learning objective, and interest of professors to integrated the Data Explorations into their teaching.
The data in the interactives are not being pulled live from the stream to ensure that they will work no matter if the original source experiences difficulties, undergoes ungrading, etc. The data within the Data Explorations will be updated periodically to include the most complete and up-to-date as possible.
Learn More about Each Collection of Data Explorations
Exploring Primary Production with Data
Through these activities, we will explore primary production in greater detail. Primary production is the rate at which organisms store energy through the formation of organic matter (carbon-based compounds), using energy derived from solar radiation during photosynthesis or from chemical reactions during chemosynthesis.
Exploring Properties of Seawater with OOI Data
These activities explore properties of seawater in greater detail, to be used as Exploration or Application activities. The properties of seawater explored include: salinity variations over time and space, processes that affect surface seawater salinity, changes in pH with depth, relationship between pH and oceanic pCO2 for the carbonate buffering system, variations in salinity with depth over time and space, and the depth of the halocline over time and space.
Exploring Tectonics & Seamounts with OOI Data
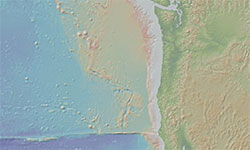
These activities explore characteristics of seamounts and tectonics in greater detail, to be used as Exploration or Application activities. The properties of seamounts and tectonics explored include: tectonic features and patterns found at divergent and transform boundaries, growth and decay of hydrothermal vents, and tectonic features and patterns of change at seamounts over time.
2019 Data Explorations Collection
These activities in this collection were developed by participants who attended the 2019 OOI Data Labs Development Workshops. Each Data Exploration in this collection has its own Instructors' Guide, written by undergraduate faculty members who used the activities in their own classrooms.
